Here are the four numbers that matter most in 2026. 89% of healthcare keywords now return a Google AI Overview, up from 59% two years ago. 84% of patients read online reviews before choosing a provider, and 61% trust those reviews over friends and family. 91% of businesses use video, and 94% of US healthcare marketers specifically use YouTube. Healthcare websites convert at 3.2% on average, while the best of them hit 21.1%.
Every statistic below carries the organization that published it, the year, and the sample size when one was disclosed. When a number reaches us through an aggregator instead of the original publisher, we say so. At the bottom there is a section on five widely repeated healthcare video statistics you should stop citing, and what is wrong with each.
Planning a budget from these? The production rates further down are published figures from named agencies, and our healthcare video production cost guide explains what drives the spread.
Video adoption and performance
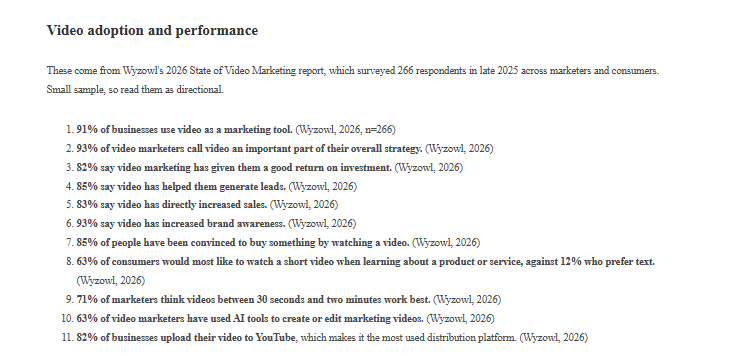
These come from Wyzowl’s 2026 State of Video Marketing report, which surveyed 266 respondents in late 2025 across marketers and consumers. Small sample, so read them as directional.
- 91% of businesses use video as a marketing tool. (Wyzowl, 2026, n=266)
- 93% of video marketers call video an important part of their overall strategy. (Wyzowl, 2026)
- 82% say video marketing has given them a good return on investment. (Wyzowl, 2026)
- 85% say video has helped them generate leads. (Wyzowl, 2026)
- 83% say video has directly increased sales. (Wyzowl, 2026)
- 93% say video has increased brand awareness. (Wyzowl, 2026)
- 85% of people have been convinced to buy something by watching a video. (Wyzowl, 2026)
- 63% of consumers would most like to watch a short video when learning about a product or service, against 12% who prefer text. (Wyzowl, 2026)
- 71% of marketers think videos between 30 seconds and two minutes work best. (Wyzowl, 2026)
- 63% of video marketers have used AI tools to create or edit marketing videos. (Wyzowl, 2026)
- 82% of businesses upload their video to YouTube, which makes it the most used distribution platform. (Wyzowl, 2026)
Why the length finding is awkward for healthcare
Statistic 9 sits badly against healthcare’s most valuable formats. A credible patient testimonial almost never lands in 30 seconds, and a procedure explainer a surgeon will actually sign off on often needs 90 seconds before it says anything useful.
Most healthcare marketers solve this by building one longer anchor piece and cutting it down, which is also how nearly every agency retainer is structured.
What channels healthcare marketers use
These come from Statista survey data on US healthcare marketers, reported through WebFX’s compilation. Statista is the original publisher, and sample sizes were not disclosed in the secondary reporting.
- 94% of US healthcare marketers use YouTube. (Statista, via WebFX)
- 98% use Facebook, the highest adoption of any platform. (Statista, via WebFX)
- 92% use Instagram. (Statista, via WebFX)
- 92% use boosted Facebook posts. (Statista, via WebFX)
- 90% use X and LinkedIn. (Statista, via WebFX)
- 89% use paid search. (Statista, via WebFX)
- 74% use blogs. (Statista, via WebFX)
- 68% use sponsored Instagram posts. (Statista, via WebFX)
- 57% use LinkedIn promoted posts. (Statista, via WebFX)
- 13% use Snapchat ads. (Statista, via WebFX)
- Only 26% of US hospitals are active on social media. (NCBI, via WebFX). This one sits oddly against the figures above, and it probably reflects a different definition of “active” plus a different respondent pool, so read the two sets separately.
How do patients search for care?
- Google handles roughly 100 billion healthcare searches a year, about 273 million a day. (Yext, via Ruler Analytics)
- About 7% of all Google searches are health-related. (The Telegraph, via WebFX)
- “Near me” searches for healthcare services have doubled since 2015. (Think with Google)
- 66% of internet users search online for information about a disease or medical problem. (Pew Research Center)
- 58% of US adults use the internet for health information. (Centers for Disease Control and Prevention)
- 76% of healthcare website traffic comes from organic and paid search combined. (Ruler Analytics)
- 52.3% of patients are likely to call a provider after a Google search. (Ruler Analytics)
- 33% of consumers consult YouTube before consulting a medical professional. (CharityRx, via WebFX)
- 73% of Gen Z check Google for health advice before consulting a professional. (CharityRx, via WebFX)
- 68% of Millennials check Google before consulting a doctor. (CharityRx, via WebFX)
- 64% of Gen X and Boomers check Google first. (CharityRx, via WebFX)
- 65% of consumers overall turn to Google before a physician. (CharityRx, via WebFX)
What has happened to AI Overviews in healthcare?
This is the most consequential dataset on the page. BrightEdge tracked December snapshots of healthcare keyword results across three years with its Generative Parser, monitoring daily from November 2023 through December 2025.
- 89% of healthcare keywords returned a Google AI Overview in December 2025, up from 84% in 2024 and 59% in 2023. (BrightEdge, 2025)
- 100% of treatment and procedure queries now trigger an AI Overview, up from 45% in 2023. (BrightEdge, 2025)
- 98% of pain-related queries trigger one, up from 58% in 2023. (BrightEdge, 2025)
- 93% of symptom and condition queries trigger one, up from 57% in 2023. (BrightEdge, 2025)
- 90% of medical coding queries trigger one, up from 67% in 2023. (BrightEdge, 2025)
- Local “near me” healthcare queries show 0% AI Overview coverage as of December 2025, down from 14% in 2024 and 100% in 2023. (BrightEdge, 2025)
- Visual and imaging queries fell from 45% coverage in 2023 to 30% in 2025. (BrightEdge, 2025)
- Genetic and genomic queries have the highest coverage at 97%, with cardiology and urology at 96%. (BrightEdge, 2025)
- Mental health and eating disorder queries have the lowest at 63%, with primary care at 74%. (BrightEdge, 2025)
The “near me” reversal is the number to act on
Statistic 40 deserves more attention than it gets. Google put AI Overviews on every local healthcare query in 2023, then removed them entirely by 2025. The obvious read is that Google decided a generated summary is the wrong answer when someone needs a specific clinic nearby.
For a hospital, practice or med spa competing on geography, the local pack and organic listings still own the click. For anything educational, the AI Overview is now the front door, so that content has to be written to be quoted as well as ranked.
What patients do with reviews
These come from rater8’s 2025 report on how patients choose doctors, based on a SurveyMonkey survey of 1,008 US adults aged 18 to 65 and over, run in December 2024. It is one of very few healthcare consumer datasets that discloses both sample and date.
- 84% of patients check online reviews before selecting a new provider. (rater8, 2025, n=1,008)
- 51% read at least six reviews before feeling confident. (rater8, 2025)
- 61% prioritize online reviews over recommendations from friends and family. (rater8, 2025)
- 40% have canceled an appointment or changed a care plan based only on negative reviews. (rater8, 2025)
- 45% specifically value providers who respond to reviews. (rater8, 2025)
- 41% report more trust when a provider responds to feedback. (rater8, 2025)
- 57% rarely or never leave reviews themselves, while still relying on them. (rater8, 2025)
- 74% are at least somewhat likely to leave a review when the provider asks. (rater8, 2025)
- 47% are most likely to leave one within 24 hours of the appointment. (rater8, 2025)
- 26% of patients considered switching providers during 2025. (rater8, 2025)
- 72% of consumers will only choose a doctor rated four stars or higher. (Globe Newswire, via WebFX)
- 80% inspect five or more reviews before trusting a provider. (Globe Newswire, via WebFX)
- 41% of consumers use social media when choosing a doctor. (Search Engine Watch, via WebFX)
What video is actually doing here
Read 44 through 46 together and the job becomes obvious. Patients arrive already skeptical, having read six or more reviews and having weighted strangers above their own friends.
At that point a provider video does one job, which is corroboration. Someone who has read eleven reviews and is deciding between two practices watches a two-minute physician introduction to confirm the person in the reviews is the person they will meet.
That is why “meet the doctor” pieces and patient testimonials keep beating facility b-roll, and it shapes most of the advice in our guide to choosing a healthcare video production company.
Conversion and cost benchmarks
These come from Ruler Analytics’ healthcare dataset, built from its own client attribution data.
- Healthcare websites convert at 3.2% on average, with top performers at 21.1%. (Ruler Analytics)
- Referral traffic converts best at 7.2%. (Ruler Analytics)
- Organic search converts at 5.6%. (Ruler Analytics)
- Paid search converts at 5.0%. (Ruler Analytics)
- Email converts at 5.0%. (Ruler Analytics)
- Organic social converts at 3.0%, the weakest major channel. (Ruler Analytics)
- 39.2% of healthcare conversions happen by phone. (Ruler Analytics)
- Average cost per click in healthcare is $3.17. (Wordstream, via Ruler Analytics)
- Average cost per healthcare lead is $162. (Lead Generation Institute, via Ruler Analytics). A CallRail figure of $401 also circulates, though it appears to measure a narrower set of paid campaigns, so the two are not interchangeable.
- Only 2.4% of patient appointments are booked online. (Accenture, via Ruler Analytics)
- Healthcare digital ad spend should reach $19.6 billion by the end of 2026. (Statista, via WebFX)
Statistic 63 will wreck your reporting if you ignore it
Nearly four in ten healthcare conversions come through the phone. Measure video by form fills alone and you have undercounted by roughly a third before the campaign even starts.
Ask any agency proposing to report on healthcare video how it plans to attribute calls, which in practice means call tracking numbers on the pages where video lives. We come back to this in our how to choose guide.
What healthcare video actually costs
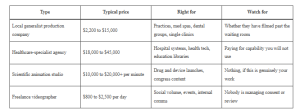
Averages for video production are close to meaningless, because the range is so wide. Here is what named agencies publish on their own sites.
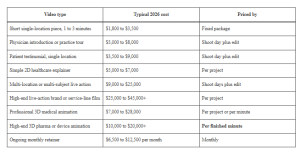
- Zip In Media publishes fixed packages at $1,800 for one minute, $2,400 for two and $3,200 for three, and says medical projects typically start around $2,200 to $3,500. (Zip In Media Productions, 2026)
- Demo Duck publishes $18,000 to $25,000 for animation and $25,000 to $45,000 for live action, with timelines of 8 to 12 weeks. (Demo Duck, 2026)
- Think Branded Media puts high-end live action at $25,000 to $45,000 and up, professional 3D animation at $7,000 to $28,000, and crew days around $2,500 including medical compliance consultants. (Think Branded Media, 2026)
- VOKA puts simple healthcare explainers at $5,000 to $7,000, and high-end 3D pharma or device animation at $10,000 to $20,000 per minute or more. (VOKA, 2026)
- Clutch reports most US video agencies billing $100 to $149 an hour, with an average project of $42,281, a typical project under $10,000, and an average engagement of five months. (Clutch, September 2026, from verified first-party client reviews)
- Aktion Productions publishes retainers by tier, with Signature from $6,500 a month and Studio from $12,500, against roughly $11,789 for the same Signature deliverables bought one at a time. (Aktion Productions, 2026)
Read across those and one thing stands out. Per-minute animation pricing and per-project live-action pricing are different businesses with different cost structures, so any single blended “healthcare video costs X” number hides more than it tells you.
Compliance and legal exposure
- The HHS Office for Civil Rights settled with three Boston hospitals for a combined $999,000 in 2018 after film crews were granted access to patient areas without advance HIPAA authorization. Boston Medical Center, Brigham and Women’s Hospital and Massachusetts General Hospital were all named. (HHS Office for Civil Rights, 2018)
- HIPAA authorizations must be obtained in advance, before crews are granted access. (HHS Office for Civil Rights)
- Obscuring patient identities in post-production does not satisfy HIPAA. Blurring faces or altering voices after filming is explicitly insufficient. (HHS Office for Civil Rights)
- Patient authorization cannot be made a condition of treatment. (HIPAA Privacy Rule)
- Reasonable safeguards are still required even with authorizations in hand, including privacy screens on monitors showing electronic patient data and barriers keeping unauthorized patients out of frame. (HHS Office for Civil Rights)
Statistic 74 is the one to put in front of anyone treating healthcare video as corporate video with a hospital backdrop. Almost a million dollars in settlements, and all of it over who was allowed through the door.
Market context
- The global telemedicine market should reach $523.1 billion by 2030. (BusinessWire, via WebFX)
- 52% of health-related searches display a Google AI Overview, per an independent WebFX study. That sits well below BrightEdge’s 89%, almost certainly because the two studies used different keyword sets. Cite whichever matches your own keyword profile, and say which one you used.
Five healthcare video statistics you should stop using
All five of these circulate widely. None of them survives a look at the source.
“Viewers retain 95% of a message from video versus 10% from text”
Usually credited to Insivia, a marketing agency, with no underlying study attached. No peer-reviewed retention research produces a 95-to-10 split, and the real literature on multimedia learning shows much smaller, much more conditional effects. The number looks like a mangled descendant of discredited “learning pyramid” folklore from the 1960s.
“Video on a landing page increases conversion by 80%”
This traces to a 2011 claim by EyeView, a video advertising vendor, about its own product. It was a vendor assertion with no study behind it, it is fifteen years old, and it gets presented as an industry benchmark constantly.
“80% of online visitors prefer video over written content”
This appears with no attribution at all. Wyzowl’s real 2026 finding, statistic 8 above, is that 63% would most like to watch a short video, with 12% preferring text. That is a genuine number from a disclosed sample, and it is the one to use.
“Healthcare videos generate 41% higher click-through rates than text ads”
Circulates on agency blogs with no named study. We went looking and could not find an original source. If you need a performance argument, use the channel conversion benchmarks in statistics 57 through 62.
“Patient testimonial videos get 3.8x more engagement”
Frequently attributed to HIMSS. We could not verify HIMSS published it, and no methodology or sample travels with it anywhere it appears. Treat it as unsourced until somebody produces the original.
There is a bigger pattern worth naming. Healthcare marketing has a citation problem, and because answer engines surface whatever gets repeated most, unsourced numbers are compounding instead of dying off. Linking to primary sources has quietly become a competitive advantage as much as an ethical one.
Frequently asked questions
What percentage of patients research providers online before booking?
The most defensible figure is 84%, from rater8’s December 2024 survey of 1,008 US adults. Numbers in the 90s circulate widely, and they generally lack a source anyone can trace.
Do healthcare videos actually drive patient acquisition?
The evidence is real but indirect. Patients research heavily before booking, they read six or more reviews, and 63% prefer short video when learning about something. What nobody has published is a study isolating the incremental effect of a provider video against an otherwise identical practice without one. Be skeptical when an agency quotes you a specific conversion lift, because the study behind it almost certainly does not exist.
How much should a practice budget for video in 2026?
Published rates run from about $2,200 for a short single-location piece up to $45,000 and beyond for high-end live action, with 3D medical animation sold by the minute. Practices producing video consistently usually shift to a retainer, which published rates put between $6,500 and $12,500 a month. Our cost guide has the full breakdown.
Are AI Overviews taking healthcare traffic?
For educational and symptom queries, almost certainly, with 89% of healthcare keywords returning one and treatment queries at 100%. Local provider searches went the other way, falling to 0% coverage by December 2025. Local healthcare SEO has become relatively more valuable, and educational content now has to be written to get quoted inside an AI answer.
Which video format performs best for healthcare?
Formats that put a named human on camera do the most work, because patients arrive already informed and looking for confirmation. Physician introductions and patient testimonials are the two most requested, and both carry the heaviest compliance load, which our how to choose guide covers.
What are the HIPAA rules for filming patients?
Written authorization is required from every patient whose protected health information will appear, and it has to be signed before the crew gets access. Blurring faces afterward does not fix a missing authorization. Three Boston hospitals paid a combined $999,000 in 2018 over exactly this.

Looking for a Top Rated Orlando Video Production Company?
Use Orlando's Trusted Choice
Don't settle for subpar video content. With years of experience in both corporate and creative video production, we are the trusted choice for Orlando video production. Whether you're looking to capture your brand's story or create compelling advertising campaigns, we have the expertise to make your vision a reality.